
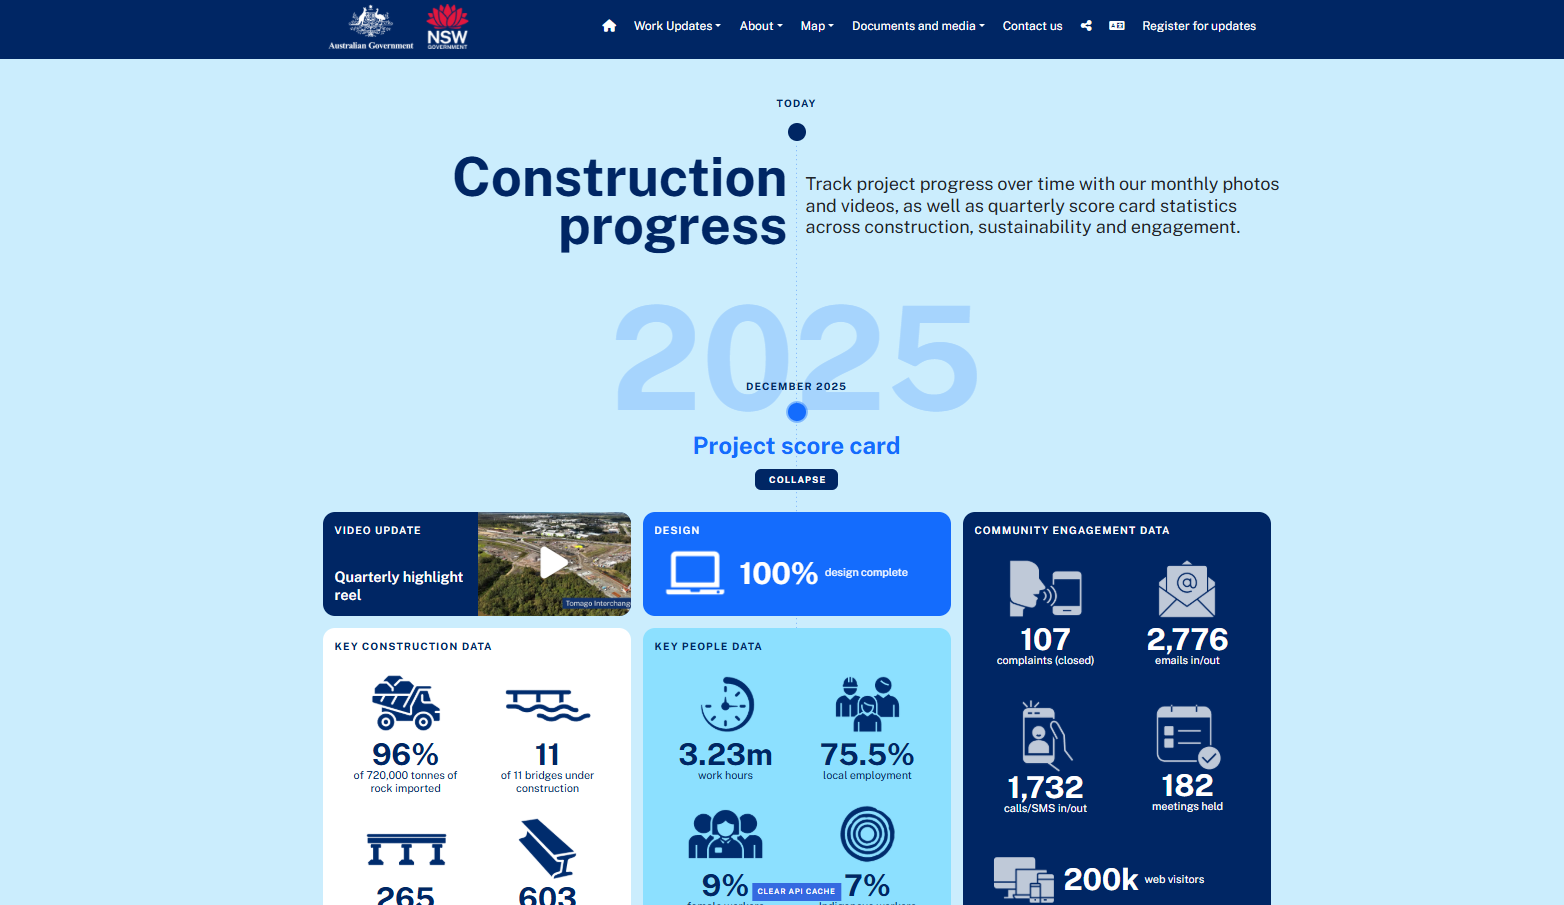
This page highlights key construction metrics (like rock moved, bridge work, drainage and asphalt progress), quarterly scorecards with photos and videos, and summaries of activity across multiple project sections. It presents complex progress data in an organised, engaging format that supports both transparency and stakeholder understanding.
The interactive construction progress visuals help the community quickly see how far construction has advanced — from design completion to the percentage of major structural works achieved in ways static text or PDFs can’t easily convey.
For the project team, the page acts as a central repository for consistent reporting across time, reducing repeated enquiries and aligning internal and external communications. By combining monthly photos, videos and measurable datapoints with intuitive graphics, users can see progress trends and understand complex build activities without technical background. The inclusion of workforce and sustainability statistics (e.g., local employment and waste diversion) broadens the narrative beyond construction to show social and environmental outcomes. Well‑designed visuals enhance engagement and retention, helping stakeholders from nearby residents to industry partners bridge the gap between technical reports and lived impact.
Finally, the page supports transparency and trust by making progress accessible and ongoing, with clear historical records that document advancement over time.

