
The purpose of this project was to develop an interactive tool that would provide the general public with accessible, detailed information about noise levels, flight paths, and other relevant data tailored to individual needs, such as specific address searches and customizable information filters.
A user-friendly interactive map was developed to meet the immediate need for public information regarding the actual impacts of the new runway's flight paths. Key solutions for this first stage of the map of the map offers:
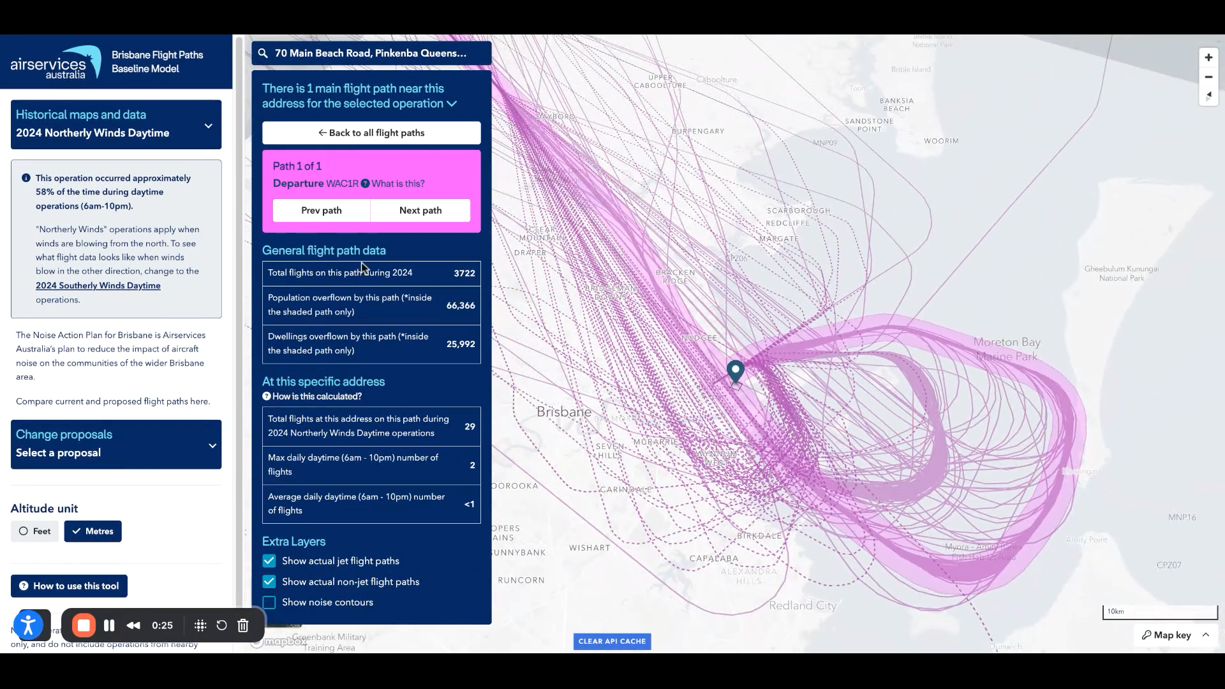
• User-Friendly Interface: Easy address search with dynamic zoom and pan map functions.
• Noise Data Visualization: Graphs show frequency of noise levels above 60 and 70 decibels, along with maximum noise contours and specific point data.
• Flight Path Tracking: Visual 'swooshes' depict real flight routes, movement counts, and altitude details.
• Demographic Overlay: Includes local population, housing, and noise-sensitive locations.
• Supporting Sidebar: Offers extra details and explanations for the data presented.
• Robust Hosting with Insights: Located on a secure Australian platform with usage analytics for ongoing evaluation and improvement

